
Real-time visibility into every ticket and agent
The Analytics Dashboard shows what AI resolved, what escalated, and how your team performs — updated live, export-ready for regulators.
Know what your operation is doing right now.
Ticket saves, message flow, closures, and team performance — all in one live dashboard.
Ticket saves
93% of incoming tickets handled by AI — no human agent required.
Message flow
72% of all message volume processed and responded to by supVision.
Final closures
49% of cases fully closed by the AI with no human involvement at any step.
Team leaderboard
Drill into any agent: response time, resolution rate, CSAT, and cases per day.
From raw events to actionable insight.
Every resolution and escalation feeds the dashboard automatically — no spreadsheets, no manual exports.
Inside the dashboard
Every chart is live — built from your actual ticket and conversation data.
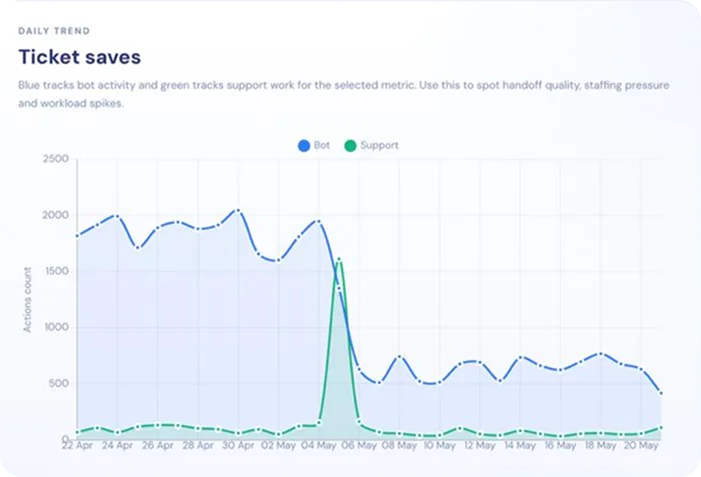
Daily Trend
Ticket saves over time
Blue tracks bot activity, green tracks support — spot handoff quality and staffing pressure before they compound.
Ownership Mix
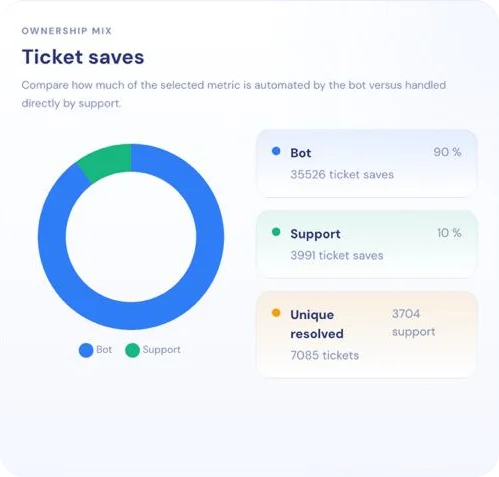
Bot vs human — ticket saves
See exactly what the AI resolved versus what reached a human agent.
Weekly Rhythm
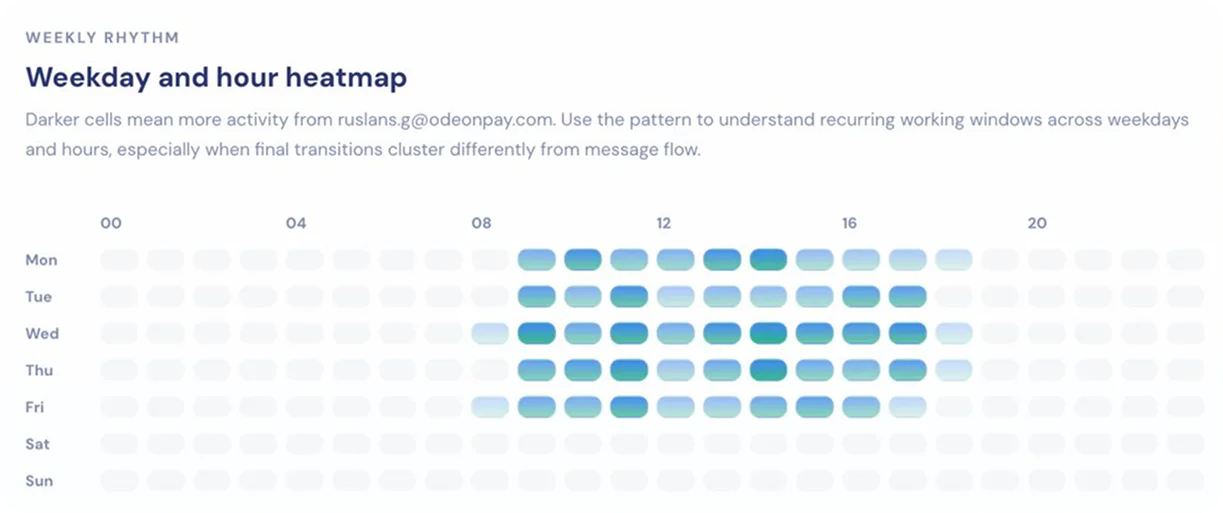
When your queue is busiest
Darker cells mean more activity. Plan human shifts around real demand, not assumptions.
Solutions · Analytics Dashboard
Analytics Dashboard
- Full workload overview: total tickets, open, closed, unresolved — updated in real time
- Bot vs human split: see exactly what AI resolved vs what reached a human
- Team leaderboard, activity heatmap, and per-agent performance drill-down
93% of incoming tickets handled by AI — no human agent required.
72% of all message volume processed and responded to by supVision.
49% of cases fully closed by the AI with no human involvement at any step.
How it works
From raw event data to
actionable insight — automatically.
Data captured in real time
Every ticket, message, resolution, escalation, and agent action is logged automatically. No manual exports. No end-of-day delays. The dashboard updates as events happen.
Bot vs human split calculated
supVision tracks what the AI resolved autonomously, what it escalated, and what went straight to a human. Each case is tagged by query type, channel, and outcome.
Trends surface automatically
Activity heatmaps, resolution time trends, and reopen rates are calculated continuously. You see patterns without writing a single SQL query or building a spreadsheet.
Export or act on insights
Share reports with your ops team, pull regulator-ready exports, or trigger escalation rule changes directly from what you see. Data that leads to action, not archives.
Inside the dashboard
Every chart you see below is live — built from your actual ticket and conversation data.
Daily Trend
Ticket saves over time
Blue tracks bot activity, green tracks support. The bot handles the vast majority of ticket saves every day.
Ownership Mix
Bot vs human — ticket saves
Bot handles 90% of all ticket saves. Support steps in for the remaining 10%.
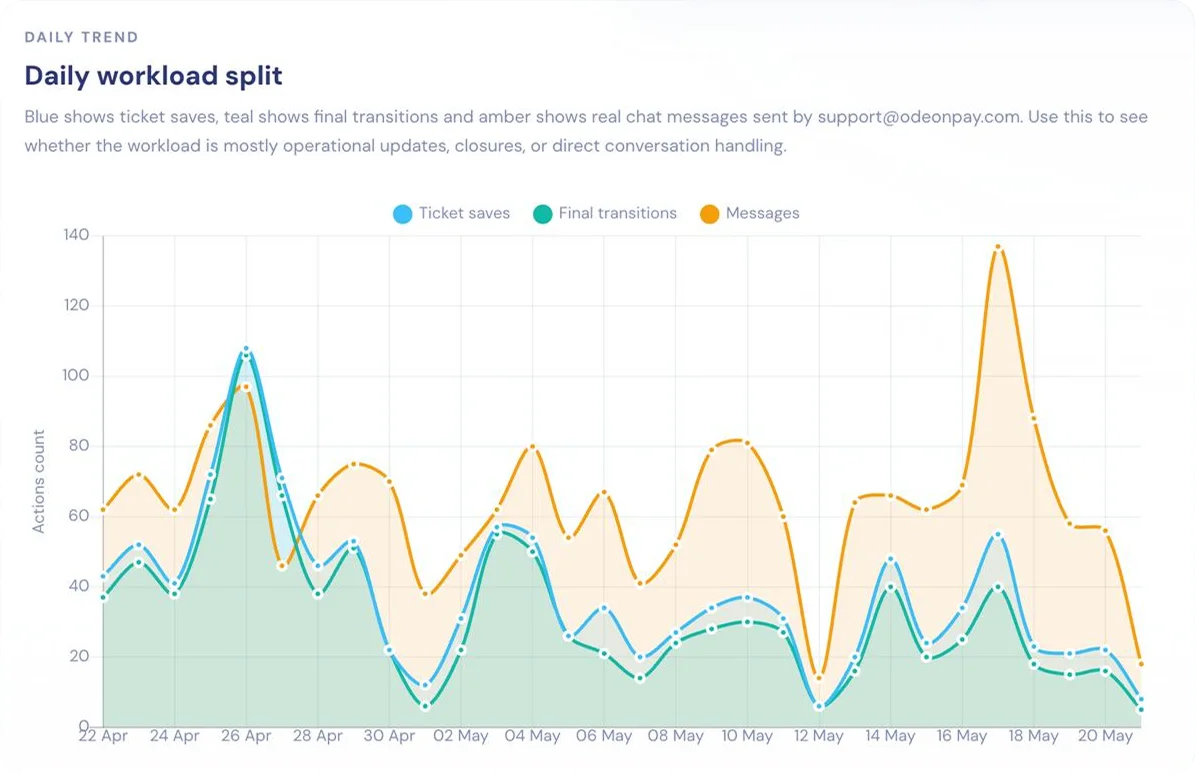
Daily Trend
Daily workload split
Ticket saves, final transitions, and messages on one chart.
Weekly Rhythm
When your queue is busiest
Darker cells mean more activity. Plan shifts around real demand.
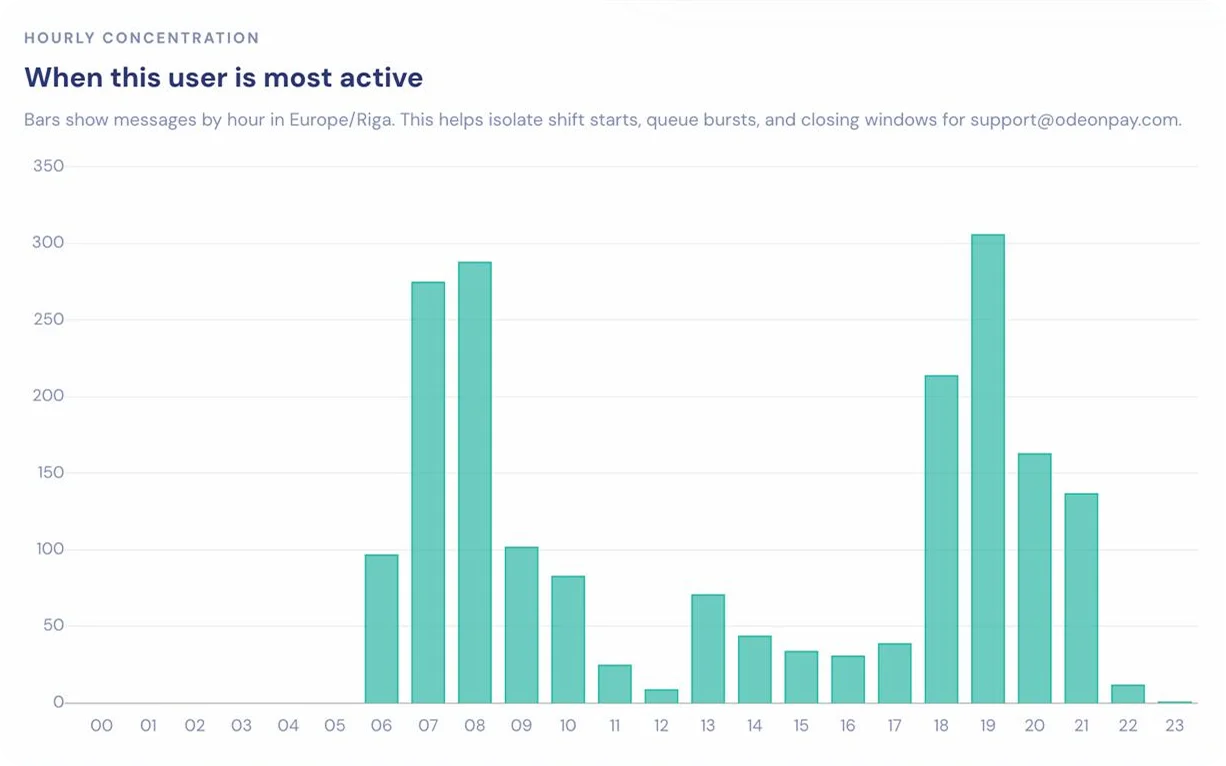
Hourly Concentration
Per-agent activity by hour
Messages by hour in local timezone — isolate queue bursts per agent.
See your support operation clearly.
Real-time visibility into every ticket, every agent, and every AI decision. Live in 3 days.